RO membrane evaluation indices are the measurable performance criteria that tell operators whether a reverse osmosis element is working as designed. Instead of judging a membrane by brand or price alone, engineers compare desalination rate, water flux, and recovery rate against the manufacturer’s rated values, then track how pressure, temperature, and feed water quality shift those numbers in real operation. A membrane that meets its rated desalination rate and flux under clean feed conditions will still fail early if the influencing factors are ignored. This guide explains every key RO membrane evaluation index, the formulas used to calculate them, and the operating factors that determine whether a system reaches its rated performance. For the physical mechanism behind these numbers, see our membrane separation principle guide.
1. RO Membrane Evaluation Indices: What a Good Membrane Must Deliver
Every RO membrane evaluation starts from the same five performance requirements. The membrane must show high water permeability and high salt rejection — a large volume of permeate flow with a high rate of salt removal. It must have good mechanical strength to minimize compaction of the porous support layer under operating pressure. It must be chemically stable against acids, alkalis, and microbial corrosion over years of service. Its structure must be uniform, because consistent pore and skin-layer quality directly controls service life and how slowly performance degrades. Finally, it must be cost-effective to manufacture from abundant raw materials, so that large desalination plants remain economical. These five requirements define the evaluation framework, and the quantitative RO membrane evaluation indices below turn them into numbers that can be compared between manufacturers and over time.
2. Desalination Rate and Salt Rejection
Desalination rate, also called salt rejection rate, is the percentage of soluble impurities removed from the feed water, and it is the single most important of all RO membrane evaluation indices. It is calculated from the salt content of the product water and the influent:
Desalination Rate = (1 − Salt Content of Product Water / Salt Content of Influent) × 100%
The salt penetration rate is the complement of the desalination rate:
Salt Penetration Rate = 100% − Desalination Rate
A new thin-film composite RO membrane typically achieves a desalination rate above 99% for sodium chloride, while nanofiltration membranes reject a smaller share of monovalent salts — the difference is one reason NF and RO are evaluated with different expectations, as covered in our types of RO membrane elements guide. Operators should compare the measured desalination rate against the rated value at the same pressure, temperature, and feed concentration; otherwise the comparison is meaningless.
3. Water Flux and Permeate Flow
Water flux measures how much permeate a membrane produces per unit time, expressed either as total flow in tons per hour or gallons per day, or as a normalized flow per unit area. The per-area value, usually given in gallons per square foot per day (GFD), is the more useful of the RO membrane evaluation indices because it is independent of element size. A higher GFD rating means the element produces more water per square foot of membrane area, which reduces the number of elements needed for a given plant capacity. The trade-off is direct: high permeation flow increases the concentration of salts at the membrane surface, accelerates fouling, and can shorten element life. Designers therefore select flux by application — low-flux designs for difficult feed water, higher flux only when feed quality is stable.
4. Recovery Rate and Its Limits
Recovery rate expresses what fraction of the feed water becomes product water, and it is the third core RO membrane evaluation index:
Recovery Rate = (Product Water Flow / Influent Flow) × 100%
A brackish water system commonly runs at 50–85% recovery, while seawater systems typically operate lower because of osmotic pressure limits. Raising recovery increases water output per unit of feed, but it also concentrates the brine side: sparingly soluble salts such as calcium carbonate, calcium sulfate, and silica approach their solubility limits, raising scaling risk. The practical recovery limit is therefore set by feed water chemistry and pretreatment, not by the membrane alone. Operators who push recovery beyond the design value trade short-term output for long-term membrane fouling — the link between recovery, concentration, and scaling is explained in detail in our preventing RO membrane fouling guide.
5. Influencing Factors: Pressure and Temperature
RO membrane evaluation indices are only meaningful at defined operating conditions, and pressure is the first variable to control. Water flux rises almost linearly with net driving pressure (applied pressure minus osmotic pressure), while salt flux is governed by concentration difference, so increasing pressure improves both flux and desalination rate — up to the element’s maximum pressure rating. Temperature has a similar but independent effect: permeate flux increases roughly 3% per degree Celsius of feed temperature rise, because water viscosity drops and diffusion accelerates. The practical consequence is that a membrane rated at 25 °C produces measurably less water at 10 °C and more at 35 °C, while desalination rate drifts in the opposite direction. Systems operating with wide seasonal temperature swings must normalize flux data to a reference temperature before comparing performance against the rated values.
6. Influencing Factors: Feed Water Quality and Operating Conditions
Beyond pressure and temperature, feed water quality determines how long the rated RO membrane evaluation indices are actually maintained. High silt density index (SDI) feed water deposits colloids on the membrane surface and progressively reduces flux. Organic matter, iron, and silica form fouling layers that resist physical flushing. Feed pH changes membrane surface charge and can hydrolyze the polyamide skin layer outside the recommended range of roughly 2–11. Concentration polarization — the buildup of rejected salts at the membrane surface — lowers the effective desalination rate even when the membrane itself is healthy, and it is aggravated by low crossflow velocity. Pretreatment that controls SDI, chlorine, and hardness protects the membrane so that the evaluation indices measured in the plant match the factory rating; the standard pretreatment train is described in our RO membrane pretreatment process guide.
7. Using Evaluation Indices to Select RO Membranes
RO membrane evaluation indices become a selection tool when they are compared against the requirements of a specific project. Start with the feed water analysis: total dissolved solids (TDS) sets the required desalination rate, feed flow and plant capacity set the required water flux and element count, and the brine solubility calculation sets the maximum recovery rate. Then compare candidate elements at the same normalized conditions — rated GFD, rated desalination rate, maximum pressure, pH range, and chlorine tolerance. A membrane with a slightly lower rated flux but a wider pH range may be the better choice for aggressive cleaning cycles, while a high-flux element wins on stable municipal feed. The table below summarizes how each index guides the decision.
| Evaluation Index | What It Measures | Selection Impact |
| Desalination rate | % salt removed from feed | Higher needed for seawater / high-TDS feed |
| Water flux (GFD) | Permeate per membrane area | Higher reduces element count, raises fouling risk |
| Recovery rate | % feed converted to product | Capped by scaling limits of brine chemistry |
| Max pressure | Operating pressure ceiling | Must exceed required net driving pressure |
| pH / chlorine tolerance | Chemical compatibility range | Wider range allows aggressive cleaning |
Compare the rated values of each candidate element side by side before purchase, and verify the actual RO membrane evaluation indices on site after commissioning, because rated values are measured under standardized test conditions that real feed water never matches exactly.
8. Monitoring Evaluation Indices in Daily Operation
Once a system is running, the same RO membrane evaluation indices become the basis of daily monitoring. Log normalized permeate flow, desalination rate, and pressure drop across the vessel at a fixed reference temperature, and compare each reading with the previous trend rather than with the factory brochure. A 10–15% drop in normalized flux, a 10–15% rise in pressure drop, or a decline in desalination rate all signal fouling or scaling and trigger cleaning. Instrumentation quality matters: conductivity meters, flow meters, and pressure gauges must be calibrated, because evaluation indices calculated from bad data are worse than no data. When cleaning is required, follow a procedure matched to the foulant — the operating pressure and flow rules for RO cleaning are laid out in our RO cleaning pressure and frequency guide.
Conclusion
RO membrane evaluation indices — desalination rate, water flux, recovery rate, and the pressure, temperature, and feed water factors that influence them — are the language in which membrane performance is specified, selected, and monitored. A membrane that meets its rated values under clean, stable conditions will only keep delivering those results if the influencing factors are managed: controlled pressure, normalized temperature data, pretreated feed, and cleaning triggered by performance trends rather than calendar dates. Use the formulas and thresholds in this guide to set up your evaluation routine, and re-measure the indices after every cleaning to confirm the membrane has truly recovered. For help selecting the right element or verifying membrane performance, contact us at [email protected] or [email protected].
FAQ:
What is the desalination rate of an RO membrane?
The desalination rate, or salt rejection rate, is the percentage of soluble salts removed from the feed water, calculated as (1 − product water salt content / influent salt content) × 100%. New thin-film composite RO membranes typically reject more than 99% of sodium chloride under rated conditions. The measured value depends on pressure, temperature, and feed concentration, so always compare it with the manufacturer’s rating at the same conditions.
How is RO membrane water flux measured?
Water flux is measured as permeate flow per unit of membrane area, usually expressed in gallons per square foot per day (GFD) or liters per square meter per hour (LMH). Total permeate flow in tons per hour or gallons per day is also used for plant-level monitoring. Flux must be normalized to a reference temperature before comparison, because flux rises roughly 3% per degree Celsius of feed temperature increase.
What recovery rate should an RO system run at?
Brackish water systems typically operate at 50–85% recovery, while seawater systems run lower due to osmotic pressure limits. The maximum recovery is set by the solubility of sparingly soluble salts in the brine — calcium carbonate, calcium sulfate, and silica — and by the effectiveness of pretreatment. Pushing recovery beyond the design value increases scaling risk even if the membrane itself is not the limiting factor.
Why does membrane performance decline even with good pretreatment?
Performance declines because of long-term membrane compaction, slow chemical hydrolysis, and residual fouling that cleaning cannot fully reverse. Compaction of the support layer under pressure reduces flux over years of operation, and exposure to pH extremes or oxidizing agents gradually degrades the polyamide skin layer. This is normal aging: when normalized flux or desalination rate cannot be restored to acceptable levels after cleaning, the element has reached the end of its useful life and should be replaced.
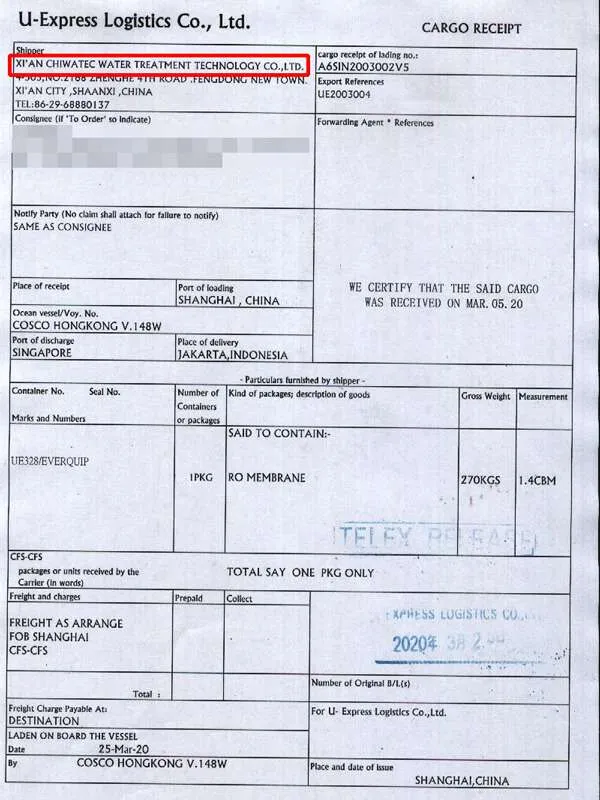
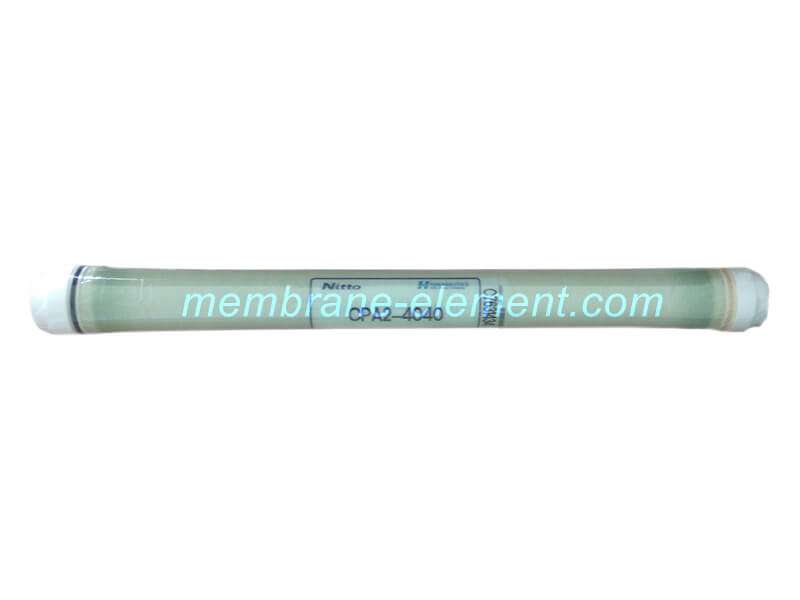
Xi’an CHIWATEC Water Treatment Technology provide the RO membrane to clients both inland and oversea with more than 10years experience. We manufacture our own brand Daltonen RO membrane and we are also the official distributor of Dupont, Toray, CSM, Nitto, LG and Vontron RO membrane. Whatever product you need, we cold meet your requirement.
Contact me for more info and best price.