The UF membrane filtration process combines sieving physics with practical engineering: operators must balance water production, washing cycles, filter element sizing and operating parameters to keep a UF system profitable. This guide focuses on the process side — water production rate calculations, washing methods, filter element area sizing and the factors that decide real-world UF performance. For the separation mechanism itself, see the ultrafiltration membrane filtration guide.
The global UF membrane market reached USD 5.6 billion in 2024 and is projected to grow to USD 10.2 billion by 2034 at a CAGR of 6.1%. Membrane elements of 0.01-0.1 µm pore size serve drinking water, industrial process water and RO pretreatment duty, where process control determines uptime. This guide covers the water production process, the UF membrane washing process, element types, area calculation and performance characterization.
Last Updated: September 2026 | Industry-Verified Technical Data
Screening Mechanism in the UF Membrane Filtration Process
Ultrafiltration is a pressure-driven screening process: the pressure difference across a semipermeable membrane drives water and small molecules through as permeate while retaining particles larger than the membrane pore size. Each meter of UF membrane contains roughly six billion micropores of about 0.01 microns, so water, beneficial minerals and trace elements pass while bacteria, colloids, rust, suspended solids, sediment and macromolecular organic matter are blocked.
This sieving behavior is the foundation of every UF membrane filtration process, but real output depends on the process parameters covered in the following sections. The ultrafiltration membrane filtration guide explains the physics in full; here we quantify the process around it.
Water Production in the UF Membrane Filtration Process
Water production in the UF membrane filtration process is governed by operating parameters that directly control permeate flow and quality. The table below summarizes the typical windows for municipal and industrial UF duty.
| Parameter | Typical Range | Impact on Performance |
| Operating pressure | 0.1-0.3 MPa (1-3 bar) | Higher pressure increases flux but accelerates fouling |
| Feed flow velocity | 1-3 m/s (cross-flow) | Higher velocity reduces concentration polarization |
| Operating temperature | 15-35 °C | Flux increases ~2-3% per °C (within limits) |
| Feed turbidity | < 50 NTU (ideal < 10 NTU) | Higher turbidity increases cleaning frequency |
| Recovery rate | 80-95% | Higher recovery concentrates feed, increasing fouling risk |
| Backflush frequency | Every 30-60 minutes | More frequent backflushing maintains stable flux |
UF systems normally run in cross-flow: feed water flows parallel to the membrane surface and continuously sweeps retained particles away, preventing a rapid cake layer from forming. Permeate leaves the module while the concentrate stream carries rejected contaminants. Balancing feed flow, operating pressure and recovery is essential for sustainable long-term operation.
UF Membrane Washing Process and Physical Cleaning Procedures
Regular washing keeps flux stable between chemical cleans. The washing stage of the UF membrane filtration process follows a defined sequence that removes loose deposits first, then tackles internal pore blockage:
| Washing Stage | Method | Duration | Purpose |
| Forward flush | High-velocity feed flow at reduced pressure | 30-60 seconds | Remove loose surface deposits |
| Backwash | Reverse permeate flow through membrane pores | 1-2 minutes | Dislodge internal pore blockages |
| Forward rinse | Low-pressure forward flow to drain | 30-60 seconds | Flush dislodged contaminants from the system |
| Chemically enhanced backwash (CEB) | Backwash with chemical additives (NaOCl, HCl) | 10-20 minutes | Remove organic fouling and biofilms |
| Maintenance clean-in-place (CIP) | Circulated chemical cleaning at low frequency | 30-60 minutes | Control long-term fouling accumulation |
Optimize frequency, duration, chemical dose and sequence for the feed water quality, membrane type and operating conditions. Over-washing wastes water and chemicals; under-washing leads to irreversible fouling and premature element replacement. For the full method matrix, flux recovery data and foulant-matched chemistry, see the ultrafiltration membrane cleaning guide.
UF Membrane Filter Element Types and Specifications
UF membrane filter elements are the core components of the UF membrane filtration process. The two primary configurations serve different duties:
- Hollow fiber membranes — the most common configuration for water treatment. Thousands of hollow fibers (0.5-2.0 mm outer diameter) are bundled in a module, and water flows inside-out (internal pressure) or outside-in (external pressure). Internal pressure designs dominate drinking water treatment because they simplify cleaning and fiber integrity monitoring.
- Flat sheet / spiral wound membranes — used mainly for industrial feeds with higher suspended solids. Membrane sheets are layered with feed spacers and permeate carriers and wound around a central permeate tube; this configuration appears more often in MF and NF than in UF systems.
Key selection specifications include membrane material (PVDF, PES, PAN), molecular weight cut-off (typically 10,000-150,000 Da), fiber inner/outer diameter, effective membrane area per module, maximum operating pressure and chlorine tolerance. Compare hollow fiber designs in the hollow fiber ultrafiltration membrane and internal pressure hollow fiber ultrafiltration guides.
Calculating UF Membrane Filter Element Total Area
Correct membrane area sizing keeps the UF membrane filtration process inside safe flux and pressure windows while meeting the water production target. Work through the chain from daily demand to module count:
| Parameter | Formula / Method | Example |
| Required permeate flow | Qp = Daily demand ÷ Operating hours | 1,000 m³/day ÷ 20 h = 50 m³/h |
| Design flux rate | J = typical flux for the application (40-80 L/m²·h for drinking water) | 60 L/m²·h |
| Net membrane area | A = Qp ÷ J | 50,000 L/h ÷ 60 L/m²·h = 833 m² |
| Number of modules | N = A ÷ Ae (effective area per module) | 833 ÷ 50 = 17 modules |
| Fouling allowance | Add a 15-25% safety margin | 833 × 1.2 = 1,000 m² → 20 modules |
The calculation must also account for fiber geometry in hollow fiber modules: effective area derives from fiber outer diameter, fiber length and fiber count per module. A typical large hollow fiber UF module contains 8,000-12,000 fibers, each 1.5-2.0 m long, delivering 40-60 m² of effective membrane area. Add the 15-25% fouling allowance before ordering modules, because flux declines 10-20% in the first year of operation as fibers compact and foul irreversibly.
Key Factors Affecting UF Membrane Water Yield
Several operating factors decide the real water yield of the UF membrane filtration process in service. Monitoring them helps operators hit production targets and diagnose shortfalls:
- Feed water quality — higher turbidity, organic content and colloidal matter accelerate fouling, demand more frequent cleaning and cut net production. Pretreatment (coagulation, sedimentation, media filtration) improves UF performance significantly.
- Operating temperature — warmer water is less viscous and yields higher flux. UF systems gain about 2-3% flux per °C within the 5-40 °C operating range, so seasonal swings can produce 30-50% flux differences between winter and summer.
- Operating pressure — higher transmembrane pressure (TMP) initially increases flux but accelerates fouling and compaction. Optimal TMP typically ranges from 0.5-2.0 bar depending on membrane type and feed quality.
- Cross-flow velocity — higher feed velocity keeps turbulence at the membrane surface, reducing concentration polarization and fouling, at the cost of higher pumping energy.
- Backwash efficiency — ineffective backwashing lets foulants accumulate cycle after cycle into irreversible fouling. Control backwash pressure (typically 1.5-2 bar), flow rate (1.5-3× permeate flow) and duration.
- Membrane age — flux declines 10-20% over the first year as membranes compact and foul irreversibly; factor this normal decline into the initial design.
Set and monitor each of these windows using the UF membrane operating parameters guide, which details flow rate, pressure, recovery and temperature optimization.
UF Membrane Performance Characterization and Materials
UF membrane performance characterization defines which element fits a given UF membrane filtration process, using parameters that quantify capability and application suitability:
| Parameter | Definition | Typical Range (UF) |
| Molecular weight cut-off (MWCO) | The molecular weight at which 90% of solutes are rejected | 10,000-150,000 Da |
| Pore size | Diameter of membrane surface pores | 0.005-0.05 microns |
| Pure water flux | Flow rate per unit area at standard conditions | 100-500 L/m²·h·bar |
| Contact angle | Measure of membrane hydrophilicity | 40-70° (lower = more hydrophilic) |
| Chlorine tolerance | Maximum free chlorine exposure over the membrane lifetime | 500-5,000 ppm·h depending on polymer (PES ≈500, PVDF ≈5,000) |
| Tensile strength | Mechanical strength of membrane fibers | 5-15 MPa |
Common UF membrane materials differ in chemistry and duty:
- PVDF (polyvinylidene fluoride) — excellent chemical resistance, high chlorine tolerance and good mechanical strength; the most common choice for municipal and industrial water treatment.
- PES (polyethersulfone) — high hydrophilicity and good flux with moderate chemical resistance; common in food, beverage and pharmaceutical applications.
- PAN (polyacrylonitrile) — good hydrophilicity, moderate chemical and thermal resistance and lower cost; used in general water treatment and some industrial processes.
- Ceramic membranes — extreme chemical and thermal resistance with long service life; used where aggressive chemicals or high temperatures rule out polymers.
Conclusion
The UF membrane filtration process is an engineering balance: size the membrane area from demand and design flux, add a 15-25% fouling allowance, then protect that capacity with a disciplined washing sequence of forward flush, backwash, rinse and maintenance cleaning.
Monitor flux, pressure and temperature against the tables above, and adjust backwash frequency and chemical cleaning to feed water quality. For UF system design, membrane sizing or process troubleshooting, contact CHIWATEC at [email protected], [email protected] or [email protected].
FAQ: UF System Water Production and Washing
Q1: How much water can a UF membrane system produce?
Output depends on installed membrane area and design flux. Start from demand: Qp = daily demand ÷ operating hours, then divide by the design flux (40-80 L/m²·h for drinking water) to get net membrane area. A system with 1,000 m² of effective area at 60 L/m²·h delivers about 60 m³/h. This calculation is the starting point of any UF membrane filtration process design.
Q2: What is a typical recovery rate for a UF membrane system?
Municipal and industrial UF systems typically run at 80-95% recovery. Higher recovery concentrates the feed and increases fouling risk, so the practical ceiling depends on feed turbidity and pretreatment. Cross-flow operation maintains the 1-3 m/s velocity that keeps the membrane surface clean at high recovery.
Q3: What is the difference between backwash and chemically enhanced backwash?
Backwash reverses permeate flow through the pores for 1-2 minutes to dislodge internal blockages, and runs every 30-60 minutes. Chemically enhanced backwash (CEB) adds NaOCl or HCl to that reverse flow for 10-20 minutes to remove organic fouling and biofilms, while maintenance CIP circulates cleaning chemicals for 30-60 minutes on a low-frequency schedule.
Q4: How do I calculate the membrane area needed for my UF system?
Use the chain: required permeate flow Qp = daily demand ÷ operating hours; net area A = Qp ÷ design flux J; module count N = A ÷ effective area per module. Then add a 15-25% fouling allowance. A 1,000 m³/day plant at 60 L/m²·h needs about 833 m² net, or 1,000 m² with allowance — about 20 modules of 50 m² each.
Q5: Why does UF flux drop in winter?
Water viscosity rises as temperature falls, which reduces flux. UF systems lose roughly 2-3% flux per °C drop inside the 5-40 °C range, so seasonal changes can cut output 30-50% from summer to winter. Either oversize the membrane area for the coldest month or preheat the feed to hold production.
Related Resources
Explore the related guides below for deeper coverage of UF system operation:
- Ultrafiltration Membrane Filtration: Complete Guide 2026
- Optimizing Ultrafiltration Membrane Process in Water Treatment: Operating Parameters Guide
- Ultrafiltration Membrane Cleaning: Complete Guide to Physical and Chemical Methods 2026
- Hollow Ultrafiltration Membrane Storage and Maintenance: Complete Guide 2026
- Dupont RO Membrane Elements
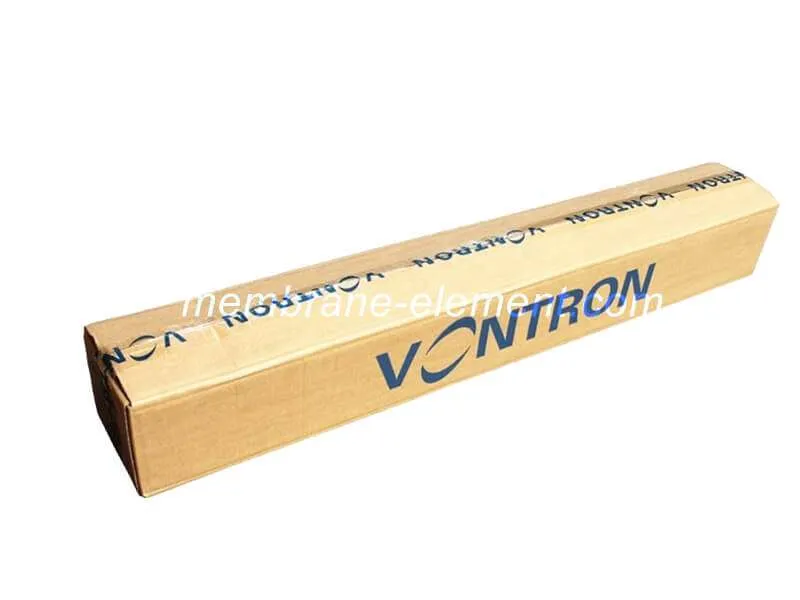
Xi’an CHIWATEC Water Treatment Technology provide the RO membrane to clients both inland and oversea with more than 10years experience. We manufacture our own brand Daltonen RO membrane and we are also the official distributor of Dupont, Toray, CSM, Nitto, LG and Vontron RO membrane. Whatever product you need, we cold meet your requirement.
Contact me for more info and best price.