Is your RO membrane system suffering from heavy contamination? Knowing how to judge membrane element contamination and implement effective solutions is essential for accurate RO membrane contamination diagnosis and for maintaining system performance while avoiding costly premature membrane replacement. This guide covers the concept of heavy membrane pollution, diagnostic techniques for identifying contamination severity, offline and online cleaning methods, and long-term prevention strategies — a complete RO membrane contamination diagnosis and remediation workflow. CHIWATEC has been engineering industrial RO membrane solutions for over a decade, providing expert diagnosis and remediation for complex fouling challenges.
Heavy membrane contamination is one of the most costly operational problems in reverse osmosis systems. Industry data indicates that improper contamination management reduces average membrane service life from 5-7 years to 1-3 years, increasing annual replacement costs by 200-400% for industrial RO installations. The global RO membrane cleaning chemicals market was valued at USD 1.6 billion in 2025 and is projected to reach USD 2.8 billion by 2034 (Grand View Research, 2025). Despite these investments, an estimated 40-50% of membrane cleaning operations are ineffective because the specific fouling type and severity are not properly diagnosed before cleaning. Systematic RO membrane contamination diagnosis can save operators 30-50% on cleaning chemical costs and extend membrane life by 2-3 years.
Last Updated: August 2026 | Industry-Verified Technical Data
Key Industry Trends in RO Membrane Contamination Management (2026)
Four trends are reshaping how operators detect and respond to heavy membrane contamination, turning RO membrane contamination diagnosis from a reactive to a proactive discipline:
- AI-powered contamination diagnosis: machine learning algorithms analyzing normalized performance data (permeate flow, salt rejection, pressure drop) can now predict fouling onset 48-72 hours before traditional monitoring methods detect it, enabling proactive rather than reactive cleaning.
- Remote membrane monitoring platforms: cloud-based SCADA systems with automated fouling index calculations allow operators to diagnose contamination severity from any location, with real-time alerts when normalized parameters exceed threshold values.
- Specialized heavy pollution cleaning services: third-party membrane cleaning service providers using ultrasonic cleaning, CO2 pellet blasting, and advanced chemical formulations are emerging as cost-effective alternatives to membrane replacement for heavily fouled elements.
- Sustainability in chemical cleaning: regulatory pressure to reduce hazardous chemical discharge is driving adoption of closed-loop cleaning systems that recycle cleaning solutions, reducing chemical consumption by 40-60% and wastewater generation by 70-80%.
What Is Heavy Pollution of RO Membrane Elements?
Defining Heavy Membrane Contamination
Heavy pollution refers to the condition where the accumulated foulants on the membrane surface have reached a level that significantly impairs system performance and cannot be effectively reversed by standard online cleaning (Clean-in-Place, or CIP). The inlet water contains suspended solids, colloids, organic matter, microorganisms, and other particles that gradually accumulate on the membrane surface and within the feedwater channels. Under normal operating conditions, the RO system design includes a safety margin to accommodate gradual fouling between cleaning cycles. However, when fouling exceeds this design margin, the system enters a state of heavy pollution characterized by rapid performance degradation — recognizing this state early is the core task of RO membrane contamination diagnosis.
Key Characteristics of Heavy Pollution
- Severe flux decline: normalized permeate flow drops by more than 25-30% from baseline
- Elevated differential pressure: pressure drop across the membrane array increases by 35-50% or more
- Increased salt passage: normalized salt rejection decreases by 2-5 percentage points or more
- Uneven performance across stages: the first stage typically shows the greatest flux decline (particulate fouling), while the last stage shows the greatest scaling (mineral concentration)
- Irreversible fouling onset: standard CIP cleaning achieves less than 50% recovery of baseline performance
RO Membrane Contamination Diagnosis: Key Normalized Parameters
Normalized Performance Data Analysis
Accurate RO membrane contamination diagnosis requires analyzing normalized performance data — raw operating data corrected for variations in feedwater temperature, pressure, and concentration. The three critical normalized parameters form the backbone of RO membrane contamination diagnosis:
| Normalized Parameter | Mild Fouling (schedule cleaning) | Heavy Contamination (immediate action) |
| Normalized Permeate Flow (NPF) | Decrease of 10-15% from baseline | Decrease of 25-30% or more |
| Normalized Salt Passage (NSP) | Increase of 10-15% | Increase exceeding 20% (often irreversible fouling or oxidation) |
| Normalized Differential Pressure (NDP) | Increase of 15-20% (particulate/colloidal fouling) | Increase of 30-50% (feed spacer blockage) |
Visual Inspection Methods
When heavy pollution is suspected, an autopsy of a representative membrane element provides the definitive RO membrane contamination diagnosis. Key visual indicators include:
- Feed channel blockage: inspect the feed spacer for debris accumulation, biological slime, or scale crystals
- Membrane surface discoloration: red-brown (iron), black (manganese/biofilm), white (scale), or yellow-brown (organic/NOM) deposits
- Permeate tube condition: scale or biofilm inside the permeate tube indicates advanced fouling
- Edge damage: telescoping or o-ring extrusion suggests hydraulic overload or freeze damage
Detailed identification of each deposit type is covered in our guide to types of RO membrane fouling.
Main Causes of Heavy RO Membrane Pollution
Primary Contributing Factors
Although RO systems are designed with a safety margin to maintain stable operation between cleaning cycles, several factors can push the system into heavy pollution territory — the same factors a proper RO membrane contamination diagnosis must account for:
- Inadequate pretreatment: the most common root cause — failure of pretreatment systems (coagulation, filtration, chemical dosing) allows excessive foulant loading onto the membranes. Studies show that 60-70% of heavy pollution cases trace back to pretreatment deficiencies — the most frequent finding in RO membrane contamination diagnosis.
- System design limitations: under-designed systems (insufficient membrane area, improper staging, inadequate cleaning system capacity) are more susceptible to rapid fouling progression
- Feedwater quality changes: seasonal variations in surface water quality, new well sources, or upstream process changes can introduce foulants that the original system design did not account for
- Improper cleaning practices: using inappropriate cleaning chemicals, insufficient cleaning frequency, or incorrect cleaning procedures can allow progressive foulant accumulation that eventually becomes irreversible
- Scale inhibitor failure: underdosing, pump failure, or expired scale inhibitor can trigger rapid mineral scaling, especially in the last stage where concentration factors are highest
For the mechanism behind each foulant category, see our guide to reverse osmosis membrane fouling causes.
Systematic Protocol for Diagnosing the Specific Fouling Type
Correlating Trends, Feedwater, and Autopsy
A systematic RO membrane contamination diagnosis protocol correlates normalized performance trends with feedwater analysis and, where possible, membrane autopsy results:
- Stage 1 predominant fouling (front-end): particulate, colloidal, or organic fouling. Check SDI values, turbidity, and TOC/COD of feedwater. Inspect cartridge filters for solids loading.
- Stage 2-3 predominant fouling (rear-end): mineral scaling. Check concentrate stream LSI, solubility indices for CaSO4, BaSO4, SrSO4, and SiO2. Review antiscalant dosing records.
- Uniform fouling across all stages: biofouling or NOM fouling. Check bacterial counts in feedwater, chlorine residual, and organic carbon levels.
- Rapid flux decline (days): acute scaling or colloidal fouling event. Investigate recent changes in feedwater source, chemical dosing, or pretreatment performance.
- Gradual flux decline (weeks to months): chronic biofouling, NOM adsorption, or gradual colloid accumulation. Review long-term feedwater quality trends.
Refer to our companion guide on RO membrane fouling types and composition for detailed identification of each foulant category, or review reverse osmosis membrane pollutant types for component-level breakdowns.
Cleaning Methods for Heavy Contamination: Online CIP and Offline Cleaning
Online CIP System Design and Operation
Clean-in-Place (CIP) is the primary method for routine membrane cleaning. A well-designed CIP system includes a chemical tank (typically 2-3 times the system volume), a low-pressure pump (15-50 psi), a cartridge filter (5-10 micron), and a heater to maintain cleaning solution temperature (30-40 °C). The standard online cleaning procedure follows these steps:
- Prepare cleaning solution: mix the appropriate chemical formulation based on fouling diagnosis. For combined organic and scale fouling, start with alkaline cleaning followed by acid cleaning.
- Low-flow recirculation (15-30 minutes): circulate cleaning solution at low flow rate (50-70% of design flow) to displace system water and allow chemical contact with the membrane surface.
- Soak period (1-4 hours): stop circulation and allow the cleaning solution to penetrate foulant layers. For heavy pollution, extend soaking to 8-12 hours.
- High-flow recirculation (30-60 minutes): circulate at maximum recommended flow rate to create turbulence and physically remove loosened foulants.
- Freshwater flush: flush the system thoroughly until pH and conductivity return to feedwater values before returning to service.
When the system is heavily polluted, the first and most critical measure is to implement a thorough cleaning protocol immediately using chemicals matched to the specific foulant composition. Delaying cleaning allows deposits to harden and become progressively more difficult to remove — establish trigger-based scheduling using our guide to RO membrane cleaning triggers.
Offline Cleaning for Heavily Contaminated Elements
Offline cleaning (also called ex-situ or bench cleaning) becomes necessary when standard CIP procedures fail to restore adequate performance — a decision point reached through RO membrane contamination diagnosis. Key indicators that offline cleaning is needed include:
- Standard CIP recovers less than 50% of baseline normalized permeate flow
- Differential pressure remains elevated by 30% or more after two consecutive CIP cycles
- Visual inspection reveals heavy deposits that standard CIP chemicals cannot dissolve
- The system has been operating without effective cleaning for more than 6 months
Offline cleaning procedure: (1) remove and label each element by position (array, stage, pressure vessel number), replacing them with spares to minimize downtime; (2) profile each element — vacuum retention below 10 inches Hg/min indicates o-ring damage or failure, and a 10-20% wet weight gain suggests heavy internal fouling; (3) run a multi-step chemical sequence — alkaline wash with surfactants (pH 11-12) for organic and biofouling removal, acid wash (pH 2-3) for scale removal, then a final alkaline rinse to neutralize and condition the membrane; (4) extend soak and recirculation — 4-8 hours of recirculation followed by 8-12 hours of soaking per chemical step (vs. 30-60 minutes online); (5) test each element on a test skid to verify performance recovery before returning it to service.
Selecting Cleaning Chemicals for Different Fouling Types
Chemical Selection Guide
Selecting the correct cleaning chemical is critical for effective contamination removal. Using the wrong chemical can set or harden deposits, making them more difficult to remove in subsequent cleaning attempts:
| Chemical Type | Effective Against | Common Formulations | Key Conditions |
| Alkaline cleaners | Organic fouling (NOM, humic acids), biofilms, oil/grease | NaOH with surfactants like sodium dodecyl sulfate (SDS) | pH 11-12, 35-40 °C |
| Acid cleaners | Mineral scales (CaCO3, CaSO4, metal hydroxides), some metal oxides | HCl, citric acid, or phosphoric acid with metal chelating agents | pH 2-3 |
| Chelating agents | Calcium sulfate, barium sulfate, metal oxide deposits | EDTA (ethylenediaminetetraacetic acid) | High pH 11-12, forms soluble complexes |
| Surfactants and detergents | Organic and biological deposits | Non-ionic and anionic surfactants | Enhance wetting and penetration |
| Biocides | Biofouling control | DBNPA, isothiazolone, glutaraldehyde | Alkaline steps only; acids may degrade some biocides |
Two-Step Cleaning Protocol for Heavy Pollution
For heavily contaminated membranes, the recommended approach is: (1) alkaline clean first to remove organic and biological layers, followed by (2) acid clean second to remove mineral scales exposed by the alkaline step. This sequence prevents organic coatings from shielding scale deposits from acid attack. Detailed compatibility rules and step-by-step chemistry are covered in our guides to RO membrane chemical cleaning rules and RO membrane cleaning agent selection.
Preventing Heavy Membrane Contamination After Cleaning
Long-Term Prevention Strategy
In pollution control for RO systems, the most fundamental measures involve controlling the design and operation of the pretreatment system:
- Optimize pretreatment: ensure coagulation/flocculation dosing is calibrated for current feedwater quality. Multi-media filters should be backwashed at least every 24-48 hours. Cartridge filters (5 micron) should be replaced when differential pressure exceeds 10-15 psi.
- Monitor SDI regularly: feedwater SDI should be maintained below 3.0 (ideally below 2.0). A rising SDI trend over days to weeks indicates degrading pretreatment performance that requires investigation.
- Clean proactively, not reactively: establish cleaning triggers based on normalized performance data (10-15% NPF decline, 15% NDP increase) rather than waiting for heavy pollution symptoms. Proactive cleaning reduces long-term foulant accumulation — see our RO membrane cleaning frequency guide for application-specific schedules.
- Scale inhibitor management: verify antiscalant dosing daily. Test for antiscalant residual in the concentrate stream quarterly. Recalculate dosing requirements when feedwater quality changes.
- Biofouling prevention: maintain continuous chlorination/dechlorination (0.5-1.0 ppm free chlorine at the RO inlet, then dechlorination to below 0.1 ppm) or use chloramines for biofouling control in high-organic feedwaters.
For the complete prevention framework, see our guide to preventing RO membrane fouling.
Replacement vs. Cleaning: When Heavy Contamination Is Irreversible
Replacement Decision Criteria
While the first measure for heavy pollution should always be a thorough cleaning attempt, RO membrane contamination diagnosis must also determine when cleaning is no longer economical. There are clear thresholds beyond which membrane replacement becomes more cost-effective than continued cleaning:
- Salt rejection below 90% (for standard brackish water membranes): indicates irreversible membrane damage from oxidation, abrasion, or hydrolysis. Cleaning will not restore rejection.
- Three consecutive ineffective cleanings: if two CIP cycles plus one offline cleaning attempt fail to restore at least 60% of baseline flow, further cleaning is unlikely to be beneficial.
- Element weight gain exceeding 20%: indicates internal fouling that cannot be accessed by cleaning solutions. The foulant mass also increases the physical stress on membrane leaves and feed spacers.
- Mechanical damage: telescoping (>5%), o-ring extrusion, fiberglass overwrap delamination, or permeate tube damage all require replacement regardless of cleaning outcome.
- Age exceeding 5 years with heavy fouling history: for elements that have experienced multiple heavy pollution events, the remaining service life is typically 6-12 months even after successful cleaning, making replacement the more economical choice.
Cost-Benefit Calculation
A simple rule of thumb: if the cost of a full cleaning cycle (chemicals + labor + downtime production loss) exceeds 30% of new element replacement cost, and the expected post-cleaning performance is below 75% of new element performance, replacement is the better economic decision.
Essential Tools for RO Membrane Contamination Diagnosis
Essential Diagnostic Equipment
Accurate RO membrane contamination diagnosis requires a combination of online instrumentation and laboratory analysis tools:
- Normalized performance software: automated data normalization tools (many major membrane manufacturers provide free software) that calculate NPF, NSP, and NDP from raw operating data
- SDI measurement kit: standard SDI-15 apparatus (0.45 micron membrane filter, pressure regulator, timer) for measuring feedwater fouling potential
- Portable conductivity/TDS meter: for spot-checking permeate and concentrate conductivity to calculate stage-by-stage salt rejection
- pH and ORP meters: calibrated instruments for verifying cleaning solution pH and feedwater oxidation-reduction potential
- Vacuum retention test stand: for testing individual membrane elements — a vacuum drop rate exceeding 10 inches Hg per minute indicates compromised membrane integrity
- Analytical laboratory services: for complex fouling cases, send a membrane element sample (or foulant scrapings) to a specialized membrane lab for SEM-EDS, FTIR, and TOC analysis to positively identify the foulant composition
Conclusion
RO membrane contamination diagnosis — judging severity from normalized parameters, visual inspection, and autopsy — determines whether to clean, how to clean, or replace. Anchor the assessment on the three normalized parameters (NPF below -25%, NSP above +20%, NDP above +30% signal heavy contamination), confirm the fouling type by stage pattern and autopsy, then apply the matched chemistry: alkaline first, acid second, with 8-12 hour soaks for heavily fouled elements. When two CIP cycles plus one offline cleaning restore less than 60% of baseline flow, or rejection has fallen below 90%, replacement is the economical decision.
Prevention after recovery is equally important: maintain SDI below 3.0, verify antiscalant dosing, and clean proactively at the 10-15% triggers rather than at heavy pollution symptoms. For expert assistance with RO membrane contamination diagnosis, customized cleaning protocols, or replacement recommendations, CHIWATEC offers comprehensive technical support for industrial and commercial RO systems worldwide. Contact us at [email protected], [email protected], or [email protected].
FAQ: Contamination Diagnosis and Cleaning Decisions
What are the key parameters for RO membrane contamination diagnosis?
The three normalized parameters are Normalized Permeate Flow (NPF), Normalized Salt Passage (NSP), and Normalized Differential Pressure (NDP). Mild fouling appears as 10-15% NPF decline, 10-15% NSP increase, or 15-20% NDP increase; heavy contamination is signaled by NPF decline beyond 25-30%, NSP increase beyond 20%, or NDP increase beyond 30-50%.
How can I tell if my RO membranes are heavily contaminated?
Heavy contamination is indicated when normalized permeate flow drops more than 25-30%, differential pressure rises 35-50% or more, salt rejection falls 2-5 percentage points, performance is uneven across stages (front-end particulate fouling, rear-end scaling), and standard CIP recovers less than 50% of baseline performance. Element autopsy confirms the diagnosis through feed spacer blockage, surface discoloration, and permeate tube deposits.
What equipment do I need for membrane contamination diagnosis?
Essential tools include normalized performance software (free from major manufacturers), an SDI-15 measurement kit, portable conductivity/TDS meter, calibrated pH and ORP meters, a vacuum retention test stand (vacuum drop exceeding 10 inches Hg/min indicates failed elements), and laboratory services (SEM-EDS, FTIR, TOC) for complex fouling cases — together they complete the RO membrane contamination diagnosis toolkit.
When should heavily contaminated membranes be replaced instead of cleaned?
Replace when salt rejection is below 90% (irreversible oxidation, abrasion, or hydrolysis damage), after three consecutive ineffective cleanings (two CIP cycles plus one offline attempt failing to restore 60% of baseline flow), when element weight gain exceeds 20%, when mechanical damage exists (telescoping over 5%, o-ring extrusion, delamination), or when elements are over 5 years old with a heavy fouling history. As a rule of thumb, if a full cleaning cycle costs more than 30% of new element replacement cost and post-cleaning performance is below 75% of new element performance, replace.
Can heavily contaminated RO membranes be saved by offline cleaning?
Yes, in many cases. Offline (ex-situ) cleaning can achieve 70-85% flow recovery even for heavily fouled elements using a multi-step sequence: alkaline wash with surfactants (pH 11-12), acid wash (pH 2-3), final alkaline rinse, with 4-8 hours of recirculation and 8-12 hours of soaking per chemical step. It also identifies irreversibly damaged elements through individual vacuum retention and weight profiling.
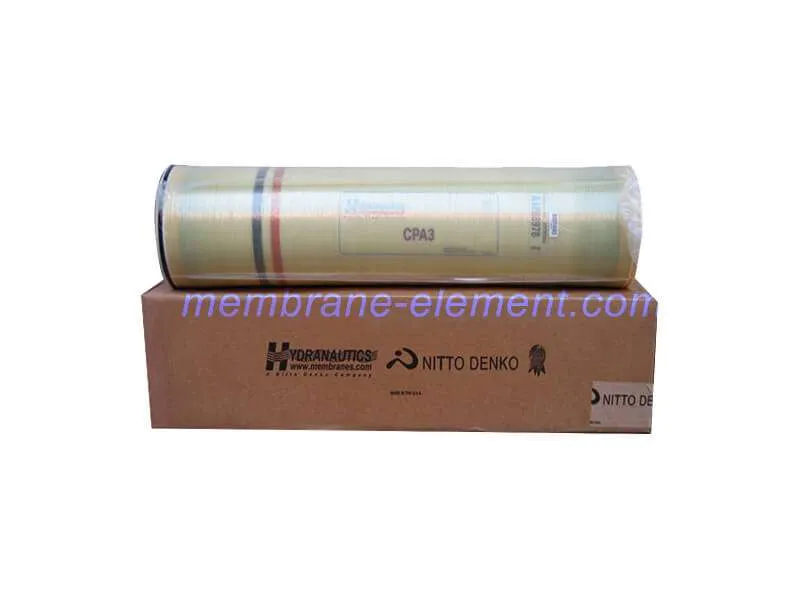
Xi’an CHIWATEC Water Treatment Technology provide the RO membrane to clients both inland and oversea with more than 10years experience. We manufacture our own brand Daltonen RO membrane and we are also the official distributor of Dupont, Toray, CSM, Nitto, LG and Vontron RO membrane. Whatever product you need, we cold meet your requirement.
Contact me for more info and best price.