This RO membrane performance FAQ answers the questions engineers ask most about feed water chemistry and membrane diagnostics. Feed water quality drives rejection, flux and element life. Therefore silica speciation, pH, TDS and early fouling signals deserve close attention. This guide covers microorganism removal and process selection. It also answers silica, pH and TDS questions. Finally, it explains contamination detection and performance testing.
The global RO membrane market reached USD 6.8 billion in 2025. Analysts project USD 12.4 billion by 2032, a CAGR of 6.2%. As a result, plant operators face rising pressure to protect membrane assets through better water chemistry control. CHIWATEC supplies high-performance RO membranes and complete reverse osmosis systems for reliable water treatment. In addition, this RO membrane performance FAQ continues our question series. Our reverse osmosis membrane FAQ covers lifespan and storage. Meanwhile the RO membrane operation FAQ answers temperature, downtime and energy questions.
Last Updated: August 2026
Microorganism Removal: Virus and Bacteria Rejection
Microbiology opens this RO membrane performance FAQ, because pathogen removal drives drinking water compliance. Yes, reverse osmosis removes viruses and bacteria very effectively. The dense active layer has an effective pore size near 0.1-1 nm. Consequently RO membranes achieve at least 3-log (99.9%) removal of viruses, phages and bacteria. Size exclusion drives the mechanism. Microorganisms stay on the feed side, while water molecules pass through the polyamide skin.
- Removal rate: 3-log or better for viruses, phages and bacteria.
- Mechanism: physical size exclusion, not chemical inactivation.
- Risk point: damaged O-rings, worn brine seals and leaking permeate joints let feed water bypass the membrane.
- Final barrier: most drinking water plants also add UV downstream.
Overall, a healthy membrane delivers essentially sterile permeate at the point of production. However, post-membrane contamination remains possible. Biofilm can colonise permeate piping and storage tanks. Therefore microbiological safety depends on three things. First, intact seals and O-rings. Second, routine conductivity and bacterial testing. Third, disciplined maintenance. Our RO virus and bacteria removal guide covers re-growth prevention in detail.
RO Membrane Performance FAQ: RO Versus Ion Exchange Selection
In short, feed water TDS decides the answer. Ion exchange (IX) suits low-salinity water. By contrast, RO handles the bulk desalination load above 500 mg/L. This part of the RO membrane performance FAQ gives the economic boundaries.
| Feed Water TDS | Recommended Process | Typical Operating Cost |
| < 500 mg/L | Ion exchange, at low to moderate flow rates | USD 0.10-0.30/m³ |
| 500-3,000 mg/L | RO, with optional IX polishing | USD 0.20-0.50/m³ |
| > 3,000 mg/L | RO, with IX only for final polishing | USD 0.30-0.80/m³ |
Most modern plants therefore combine both technologies. RO first removes 95-99% of dissolved solids. Then a mixed-bed ion exchanger polishes the permeate to 18.2 MΩ·cm resistivity. This hybrid design cuts IX chemical regeneration frequency by 90-95%. Because regeneration drives IX operating cost, the saving is decisive on high-TDS water.
Pharmaceutical, power generation and electronics plants therefore standardise on RO+IX. In contrast, standalone IX stays competitive below 500 mg/L at small flows. Check the RO membrane feed water requirements before you fix the process train. Also review our RO membrane evaluation indices to set realistic permeate targets.
Silica Removal: Active Versus Colloidal Forms
Silica exists in two distinct forms. Therefore each form needs a different removal route. Active silica is monomeric silicic acid (H₄SiO₄) below 1 nm. Colloidal silica is polymerised, and it measures 5-100 nm.
| Silica Form | Size | Effective Removal | Ineffective Methods |
| Colloidal (polymerised) silica | 5-100 nm | RO 90-99%, ultrafiltration, coagulation-clarification with alum or ferric chloride | Ion exchange resin, CEDI (no ionic charge to exploit) |
| Active (reactive) silica | < 1 nm | RO 90-97% depending on pH, strong base anion resin (Type II preferred), CEDI | Media filtration, clarification, air flotation |
Rejection of active silica improves above pH 8. Silicic acid ionises at higher pH, so the membrane rejects the charged species more strongly. Above 30 mg/L total silica in the feed, scale control becomes the design driver. Limit concentrate silica below 100 mg/L without antiscalant. With a specialised silica antiscalant, 240 mg/L is achievable. Also, higher temperature and pH above 8.0 raise silica solubility. This RO membrane performance FAQ keeps the detail short. For boiler-feed carryover and full design limits, see our silica removal in RO water treatment guide.
pH Effects on Rejection, Water Production and Membrane Life
Of course, pH ranks among the most asked topics in any RO membrane performance FAQ. Standard polyamide membranes operate between pH 2 and 11 continuously. Cleaning tolerates pH 1 to 12 for short exposures. pH barely touches the polymer itself, which is a real advantage of RO. However, pH strongly changes the rejection of specific species through ionisation.
- Weak acids: silicic, boric and citric acids stay uncharged at low pH, so they pass more easily. At high pH they dissociate, and the membrane then rejects them. For example, boron rejection rises from roughly 40% at pH 7 to 90% at pH 10.
- Dissolved gases: CO₂, H₂S and NH₃ pass as neutral molecules at low pH. At high pH they ionise and get rejected. Multi-pass systems exploit this with inter-pass pH adjustment.
- Water flux: pH does not change permeability significantly inside the normal range. Small flux shifts come from osmotic pressure changes, not from polymer swelling.
- Membrane life: service life stays unaffected within the specified range. However, excursions below pH 1 or above pH 12 accelerate hydrolysis and shorten life.
Finally, two related guides go deeper. Our RO product water pH guide explains why permeate pH drops one to two units. Similarly, the boron removal guide covers two-pass high-pH design for WHO compliance.
Feed Water TDS and Conductivity Conversion
TDS and conductivity track each other closely in most natural waters. However, the conversion factor depends on ionic composition. Sodium chloride waters convert differently than sulfate or bicarbonate waters. This RO membrane performance FAQ therefore lists the common ratios.
| Water Type | Typical TDS / Conductivity Ratio |
| Seawater | 1.4 (TDS mg/L = 1.4 × EC in µS/cm) |
| Brackish water | 1.3 |
| Surface water | 1.2-1.5 |
| Groundwater | 1.3-1.7 |
| Sodium chloride dominant | 1.5-1.7 |
| Sulfate or bicarbonate dominant | 1.2-1.4 |
Designers therefore use these ratios when only conductivity data exists. Projection software such as ROSA and IMSDesign needs an ionic feed analysis. For a quick estimate, TDS in mg/L equals about 0.64 times conductivity in µS/cm. That approximation suits screening work only. For a final design, order a direct gravimetric TDS test and a full ion balance. Feed TDS also sets osmotic pressure. Osmotic pressure in turn sets the required RO membrane operating pressure.
Contamination Indicators: How to Tell a Membrane Is Fouled
Fouling shows up in normalised operating data long before visible damage appears. Thus this RO membrane performance FAQ section focuses on measurable indicators. Track four parameters daily. Then compare each value against the commissioning baseline.
| Indicator | Action Threshold | What It Signals |
| Normalised permeate flow | 10-15% decline | Surface fouling or scaling; schedule cleaning |
| Feed pressure at constant output | 10-15% increase | Loss of permeability across the active layer |
| Pressure drop (ΔP) feed to concentrate | 15-20% increase | Feed-channel blockage by biofilm or particulates |
| Salt rejection | Rise or fall versus baseline | Scale forms a secondary barrier; biofouling degrades rejection |
Two physical checks confirm the data. First, weigh a suspect element after removal. Fouled elements gain significant weight from scale, biofilm and particulate matter. Second, run the water channel test. Hold the element vertically and pour water onto the feed end face. Water should flow through the element. If it overflows the face instead, the feed channels are fully blocked. Finally, that element needs replacement rather than cleaning.
Above all, match the symptom to the foulant before you buy chemicals. Our types of RO membrane fouling guide maps each signal to a foulant class. Next, the RO membrane contamination diagnosis guide sets severity thresholds. Then our cleaning agent selection guide picks the chemistry.
RO Membrane Performance FAQ: System Performance Testing Methods
Test the system in three escalating stages. Each stage narrows the fault from plant level to a single element. This section of the RO membrane performance FAQ gives the standard sequence.
- Routine monitoring, daily: log feed pressure, permeate flow, concentrate flow, conductivity and temperature. Then calculate normalised values. Investigate any sudden change.
- Troubleshooting, when performance declines: measure permeate TDS from each pressure vessel. Use a conductivity probe with a flow cell at every vessel sample port. This isolates the vessel that holds compromised elements.
- Element-level diagnosis: remove the suspect elements first. Next, run a vacuum test for O-ring integrity. Also run a reverse pressure test for seal damage. Finally, probe along the permeate tube to locate internal leakage.
Thus standard test skid conditions give the most reliable comparison: 2,000 mg/L NaCl, 15.5 bar, 25°C, pH 6.5-7.0 and 15% recovery. For chronic problems, sacrifice one element for a full autopsy. A complete autopsy includes visual inspection and loss-on-ignition analysis. It also adds scanning electron microscopy (SEM) and energy-dispersive X-ray spectroscopy (EDS). The foulant composition then guides pretreatment upgrades, as our RO membrane pretreatment process guide explains. Trending the same data also sets a realistic RO membrane cleaning frequency.
Low-Energy and Ultra-Low-Energy Element Selection
Overall, low-energy elements trade a little rejection for a large energy saving. Choose them when energy cost dominates the operating budget. They also fit plants with moderate permeate quality targets.
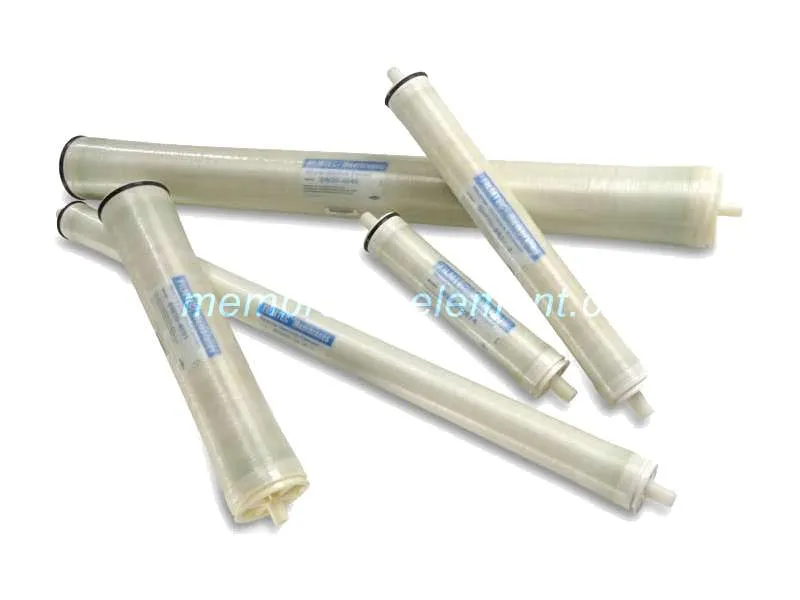
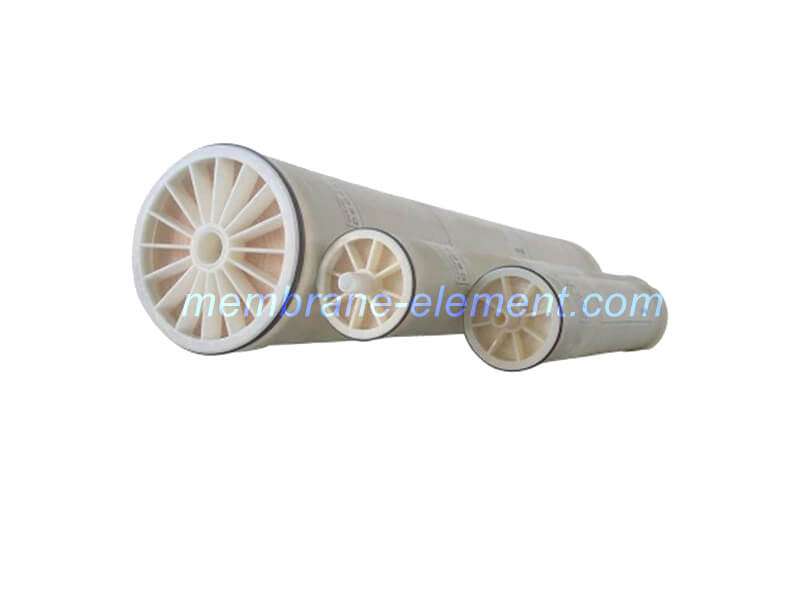
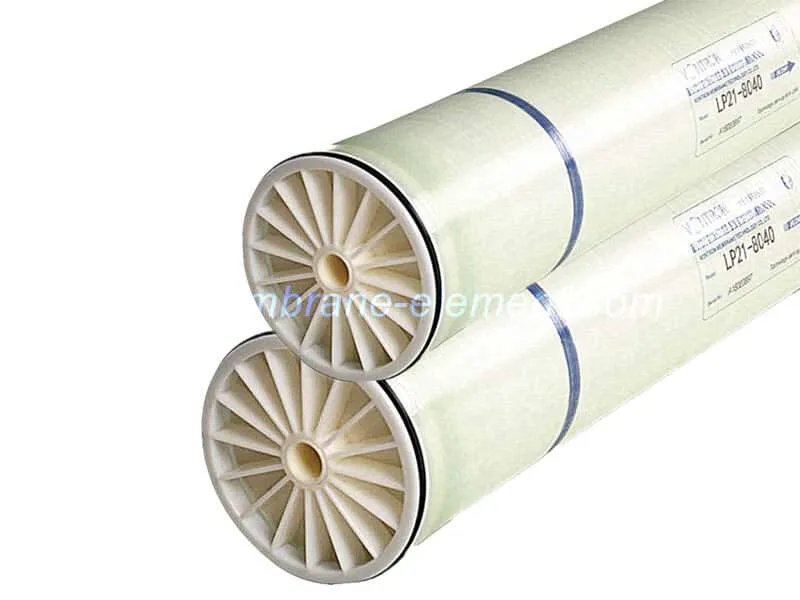
- Low-energy (LE, LP): operate at 8-10 bar against 12-15 bar for standard brackish elements. They cut specific energy by 15-25% and still deliver 98-99% salt rejection.
- Ultra-low-energy (XLE): operate at 5-7 bar, roughly half the energy of a standard BW30 element. However, salt rejection drops to 95-97%.
- Best fit for XLE: agricultural irrigation, cooling tower makeup and low-pressure boiler feed.
Four conditions justify a low-energy specification. First, energy costs above USD 0.10/kWh. Second, feed TDS below 2,000 mg/L. Third, moderate product water quality requirements. Fourth, operation for 16-24 hours per day. By contrast, applications demanding salt passage below 0.5% still need standard high-rejection elements. Run a life-cycle cost analysis first, because lower pressure usually means more elements for the same output. Our low energy RO membrane elements guide compares the families in detail. Similarly, our types of RO membrane elements guide explains each construction. That closes our RO membrane performance FAQ selection topic.
Conclusion
Feed water chemistry decides RO performance. Silica speciation, pH and TDS set achievable rejection. Meanwhile normalised flow, pressure and ΔP reveal fouling early. Therefore disciplined logging beats reactive cleaning every time. Use this RO membrane performance FAQ as a working checklist during commissioning and troubleshooting.
Xi’an CHIWATEC Water Treatment Technology supplies RO membrane elements, complete reverse osmosis systems and technical support worldwide. Our engineers help you match membrane type, pretreatment and cleaning programme to your actual water analysis. Contact us for element selection, projection runs or a fouling investigation:
FAQ: RO Water Chemistry and System Diagnostics
Q1: Does a reverse osmosis system produce sterile water?
A healthy membrane delivers essentially sterile permeate at the point of production. It removes at least 3-log of viruses and bacteria. However, biofilm can grow downstream. Therefore add UV disinfection after the membrane and test permeate bacteria regularly.
Q2: What silica concentration limits RO recovery?
Keep concentrate silica below 100 mg/L without an antiscalant. A specialised silica antiscalant raises that limit to about 240 mg/L. Above 30 mg/L feed silica, treat scale control as a design driver. Higher pH and temperature also help.
Q3: Can I estimate feed TDS from a conductivity reading?
Yes, for screening only. TDS in mg/L equals roughly 0.64 times conductivity in µS/cm. Ratio factors range from 1.2 to 1.7 by water type. For a final design, however, order a gravimetric TDS test and a full ion analysis.
Q4: What is the earliest reliable sign of membrane fouling?
Normalised permeate flow decline is the earliest signal. A 10-15% drop against baseline triggers cleaning. By contrast, a 15-20% rise in feed-to-concentrate pressure drop points to feed-channel blockage.
Q5: When should I choose XLE elements over standard elements?
Choose XLE when feed TDS stays below 2,000 mg/L and energy costs exceed USD 0.10/kWh. Permeate quality targets must also stay moderate. Standard elements remain necessary whenever salt passage must stay below 0.5%.
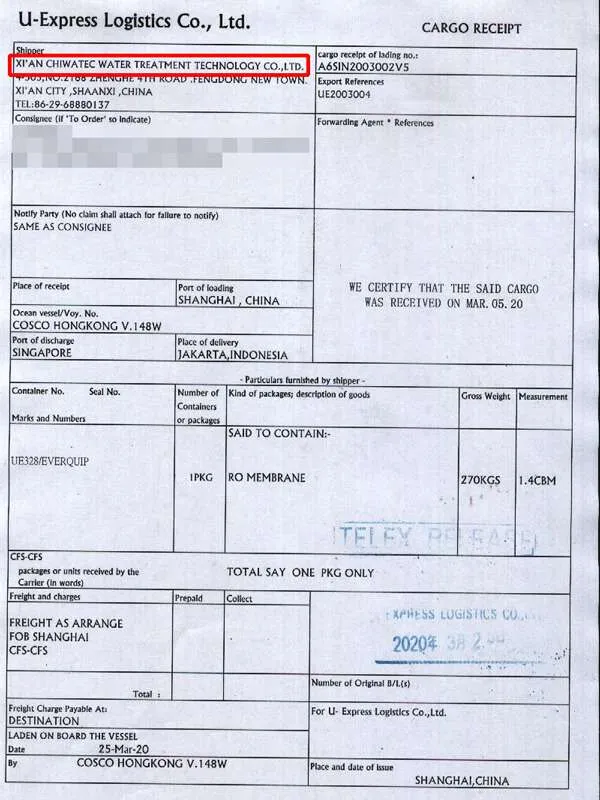
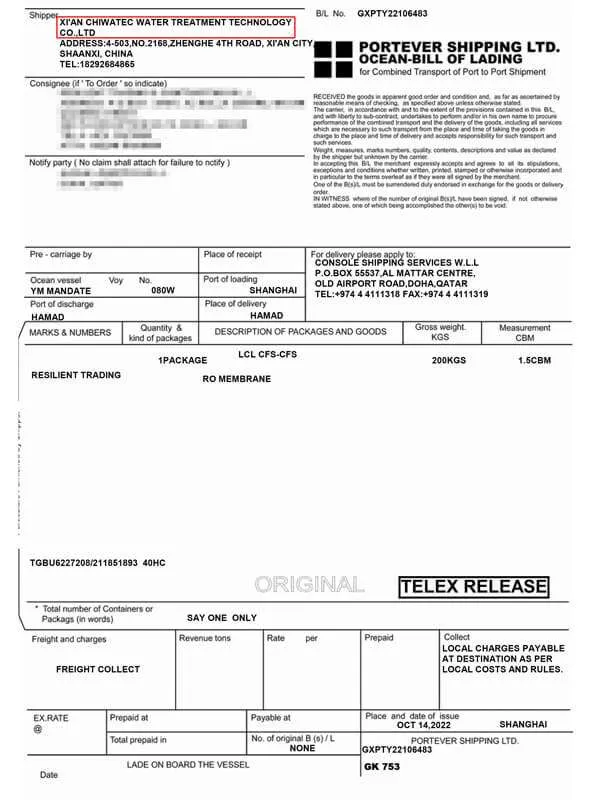
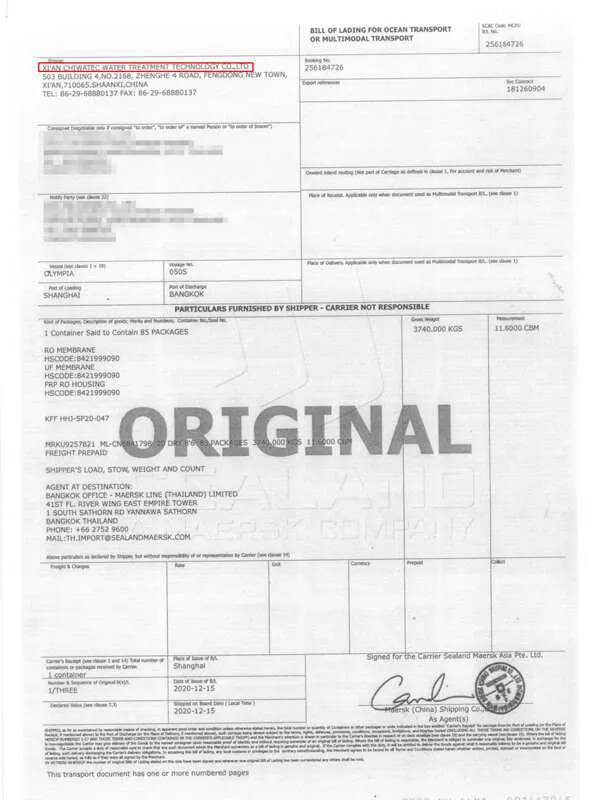
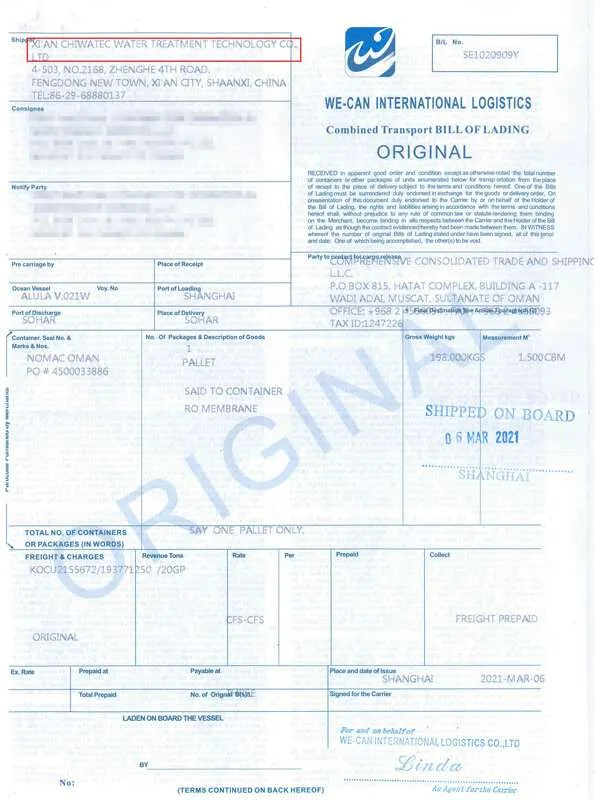
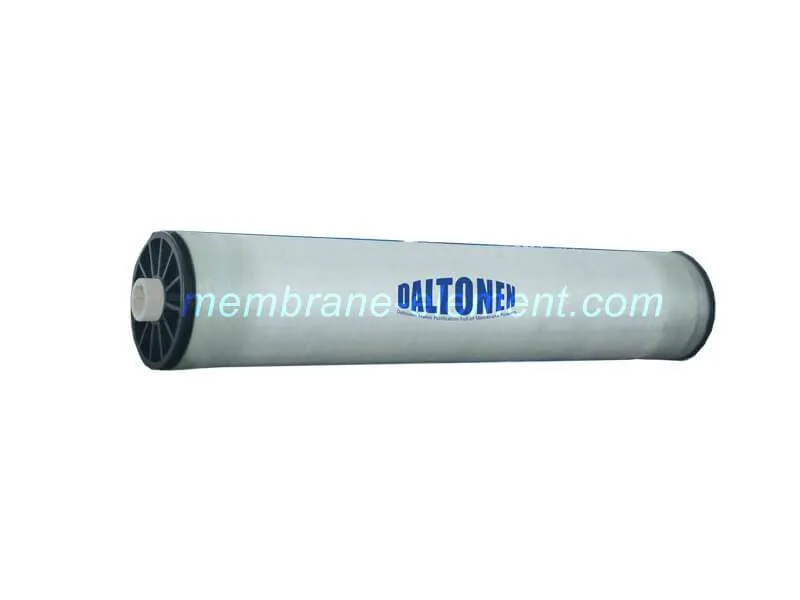
Xi’an CHIWATEC Water Treatment Technology provide the RO membrane to clients both inland and oversea with more than 10years experience. We manufacture our own brand Daltonen RO membrane and we are also the official distributor of Dupont, Toray, CSM, Nitto, LG and Vontron RO membrane. Whatever product you need, we cold meet your requirement.
Contact me for more info and best price.